Lavender Discord
Run one command. See your volatility chart instantly.
Lavender Discord gives you on-demand access to Lavender's analytics engine — directly inside Discord. Type a command, get a professional-grade volatility chart in seconds.
No code. No setup. No browser. Just results.
What You Can See:
Seven commands. The full picture
/surf — The full volatility surface for any ticker. Strike vs. expiry, rendered as a 3D chart. See the shape of the market at a glance.
/skew — Strike skew for any underlying and expiry. Understand how the market is pricing tail risk across strikes.
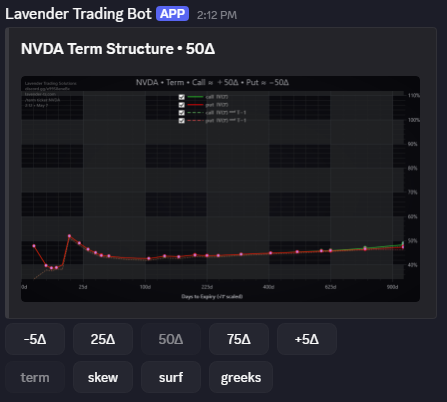
/term — Term structure across expirations. See how implied volatility changes through time for any name.
/greeks — Greeks profiles across strikes and maturities. Delta, gamma, vega, theta — computed with discrete dividends and early exercise handling.
/bscomp — Side-by-side comparison of Binomial vs. Black-Scholes pricing for any option. See exactly where the two models diverge — and by how much.
/volcomp — Compare implied volatility across two different underlyings. Useful for relative value analysis and spread positioning.
/grid — A structured grid view comparing volatility or other metrics across strikes and expirations. See the full picture in one organized output.
As Simple As It Gets
How to access Lavender Discord:
Join the Lavender Discord.
Type a command - for example: /surf ticker: AAPL
Your chart or output appears instantly
No account setup beyond Discord. No vendor credentials. No installation.
The same analytics engine that powers Gateway, delivered through the simplest interface possible. Analytics only - not trade advice.
Complimentary Access
Free — Join today at no cost
Access to all seven commands
100 commands per day
No credit card required
Built for Practitioners Who Want Answers Fast
Options traders who want to see volatility structure on any name without building their own tools
Quantitative researchers who want a quick visual on surface shape, skew, or term structure before going deeper
Developers and quants exploring Lavender's analytics before integrating via Gateway
Traders evaluating model differences who want to see Binomial vs. Black-Scholes divergence on a specific name
Anyone paying for data who wants a second opinion on what the surface or greeks look like right now
See what your ticker looks like right now.
Run up to 100 commands per day, no credit card required.